Improve Data Visualization By Mapping with Microsoft Excel
News provided by Topo.ly Mapping Made Simple on Thursday 29th Nov 2012
To help businesses convey their ideas through data visualization, Topo.ly offers the latest mapping and geocoding technology. By using visual data analytics tools, a manager will not only become a “data viz” whiz, but he or she will also deliver practical growth strategies and optimal expansion opportunities. Topo.ly has been used by different organizations such as small businesses, universities, non-government organizations, schools, sales consulting, and others to provide clear visualization of the data they gathered and stored from their Microsoft Excel spreadsheets.
For new small business owners who are unfamiliar with “data viz” or data visualization, they may initially feel intimidated. They may even lose their way and become entangled in the web of data available in their systems. But once business owners have learned the value of data visualization, they can use it to enhance their decisions and save time.
How Topo.ly and Excel Promote Data Visualization
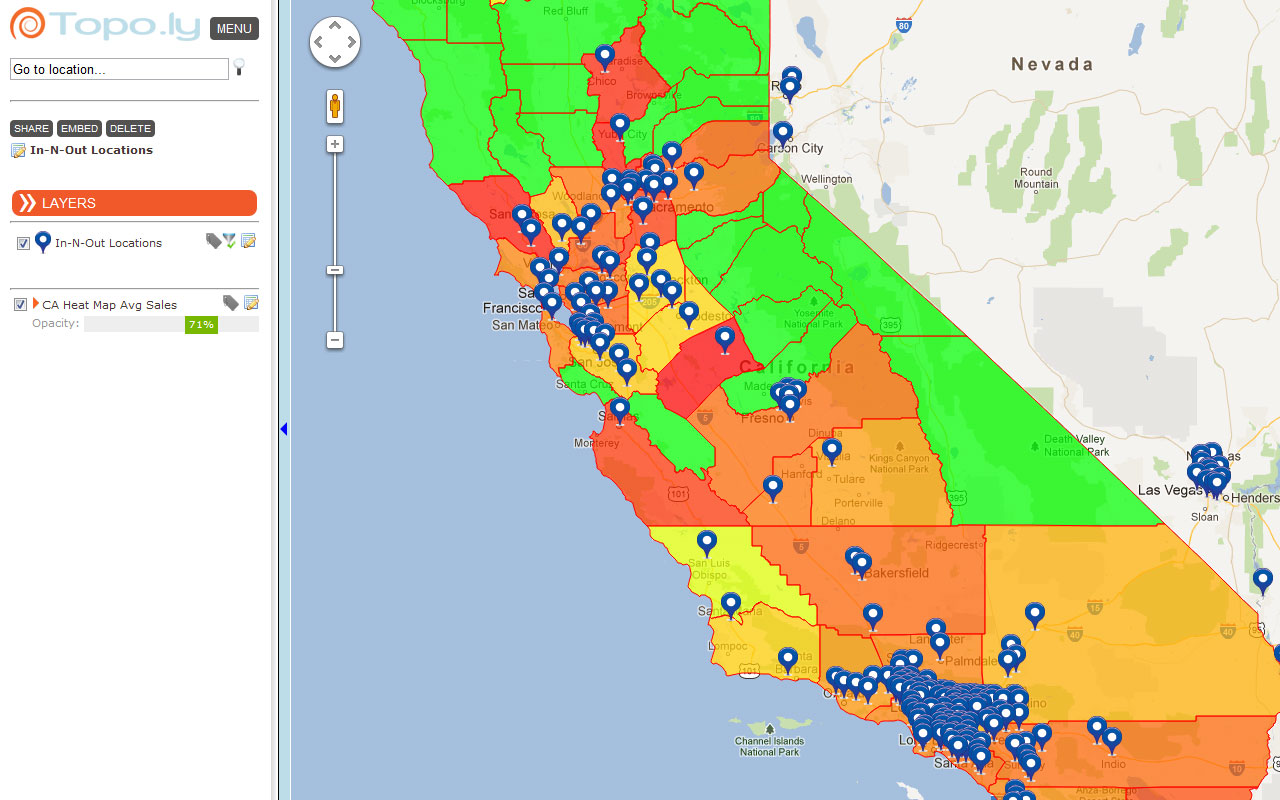
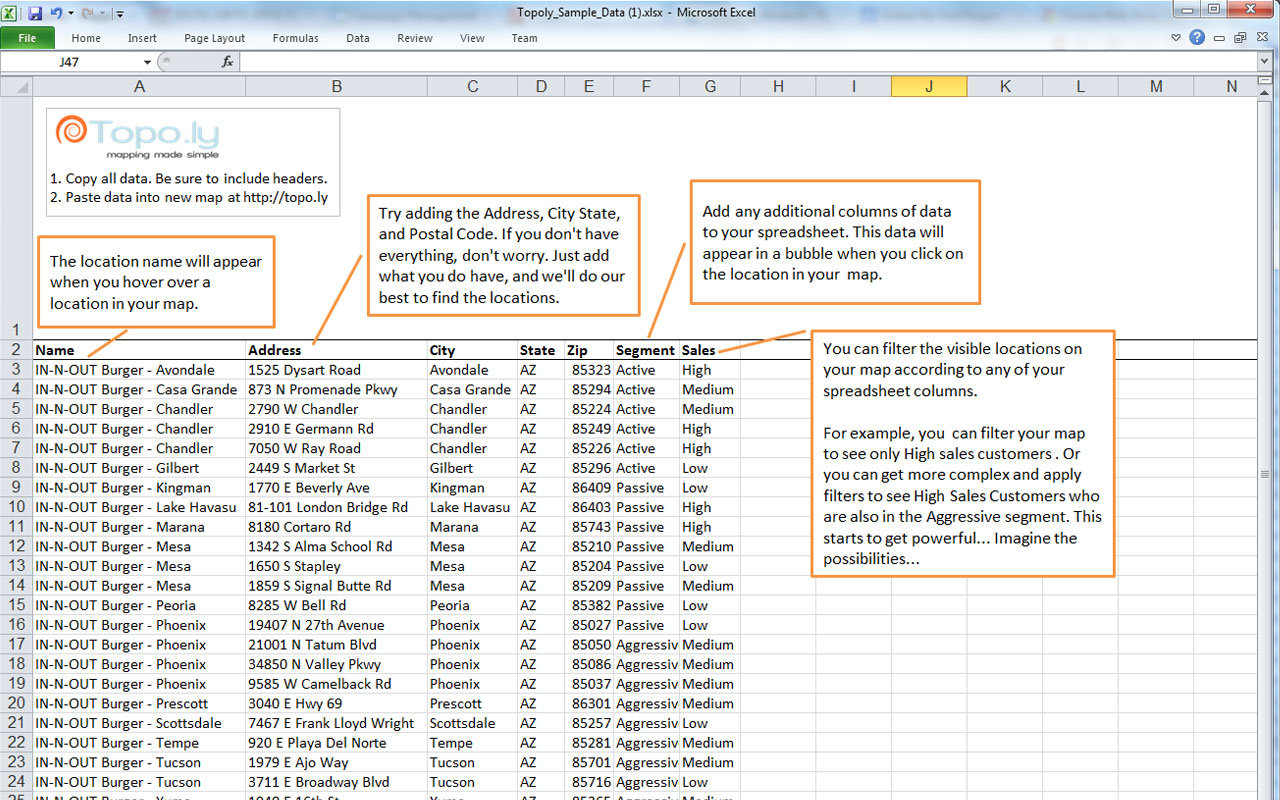
For decades now, Microsoft Excel spreadsheets are used to store vast amounts of data. These spreadsheets can be used to create maps to easily interpret data. The mapping visualization provided by Topo.ly make it possible for companies to save enormous amounts of time. By pasting their spreadsheet data into Topo.ly, businesses can visualize their data within minutes. A simple look at their map can help them understand business growth and identify opportunities to mitigate the risks and connect with their customer.
Businesses from different industries are encouraged to try out the service. Free registration is available to business owners so they can start to build their maps for free. They can also take advantage of the Plus Membership where they can be able to enjoy advance mapping features for only $20 a month. From this small fee, users can:
- Add infinite number of data sets
- Add territory layers
- Build heat maps
- Customize markers
- Embed maps on websites
- Show location labels
- Save unlimited maps
Indeed, Topo.ly is a reliable business intelligence mapping application to help businesses understand and visualize data. For further inquiries or concerns, visit the website or email the company at contact@topo.ly
Press release distributed by Pressat on behalf of Topo.ly Mapping Made Simple, on Thursday 29 November, 2012. For more information subscribe and follow https://pressat.co.uk/
Build Maps For Free Mapping Maps Analysis Data Visualization Microsoft Excel Spreadsheet Business & Finance Media & Marketing
You just read:
Improve Data Visualization By Mapping with Microsoft Excel
News from this source:


